
Skybadger Observatory
As part of setting up an automated observatory, one of the instruments we will need is a way to look at the sky and the environment around us so we know its safe ( in the expensive sensitive equipment meets rain and weather sense) to operate This is then used to control when the observatory operates by combining the input from a Sky Quality Meter (SQM Meter) which measures the sky brightness
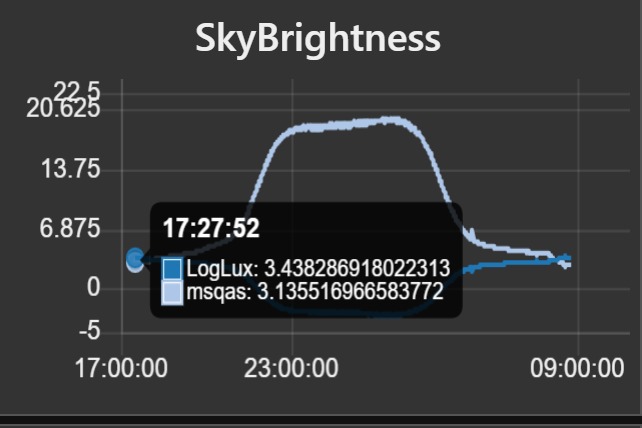
The Sky quality Meter (SQM) is the sensor that tells the observatory the state of the sky. It provides two values - the sky temperature in Celsius and the sky brightness in Magnitudes per square arc-second derived from a lux measurement.
The Sky brightness reading tells us how dark the sky is - typically for me it varies from 17 mags/square arc-sec at full moon to 21.0 on the rare darkest nights. It depends on teh state of the moon, haze and so on.
The sky temperature reading can give a direct reading of when its clear, since the sky temperature drops below zero, as far as -35C in the winter, when there are no clouds in the sky due to that being the ambient temperature of the
bulk of the atmosphere above the cloud layer.
The sky temperature reading is therefore in need of some degree of interpretation. When my local prevailing conditions apply:
Including input from the all sky camera would be a powerful cross-check but until I have coded some way of measuring the sky 'clearness' from the images of the night sky, the SQM remains the best way. The device also tells me the ambient temperature of the sensor, which is useful at night but less so during the day when insolation - heating of the box from the sun, raises it well above what you might consider the real temperature. The skybrightness meter helps to corroborate the all sky camera in terms of telling us whether its cloudy or clear since the brightness increases when there is more cloud due to light pollution.
Putting this information together with the cloud image and the observing conditions data allows the Observatory automation tools to make decisions on whether to automatically open up and continue or whether the cloud is here to stay and pack up safely..
this happens because I have an Alpaca "Observing Conditions" driver measuring components like the SQM and temperature readings and mixing them with other environmental parameters to make an IsSafe decision which is exposed via the ASCOM Alpaca Safety driver.
Both of these drivers are created, run and accessible through the NodeRed dashboard that allows manual distance control fo the scope and dome over the web.
The SQM consists of the common TLP4122 sensitive light sensor paired with the Melexis 9142 Infrared thermometer. The latter provides the ambient and sky temperature readings, while the first is a multi-range device that you can set the gain and collection time on. This is the family of devices used in the Unihedron SQM commercial device. Both of these sensor chips use the I2C two-wire bus to present their readings as slave devices to a master device. I implemented my standard pattern ESP8266/MQTT/web firmware pattern with the chip i2c interface talking to the above devices. The readings are sampled, averaged and reported to the MQTT messaging service and theb visualised by the MQTT listener at the Node-Red dashboard for all sensors. The hardware pattern is a fairly straightforward assembly of voltage regulator, ESP8266-01, i2c bus pullup resistors and the devices themselves. The light sensor is illuminated using a plastic LED torch lens used as a collector, available in different viewing angles, from ebay and elsewhere. The code provides a routine for the light sensor to control the gain and collection time to keep the values in the centre of the range. The sensor is franed by a led torch lens focuser to collect asmuch light as pssible from the sky and covers an effective field of about 30 degrees.
The device code is on Github in a public repository that you can clone and alter as needed.
In use I have two ways of calibrating this device- directly by comparison agsint the SQM and also by comparison against imaged data. The ASTAP tool provides a means of applying pghotmoetry of stars to provide a measure of the backgroun brightness recorded in an image. Interestingly, while my meter typically records 0.3 Mag above the handlheld SQL, it also typically records at least 2.5 Mag fainter than the ASTAP results. The sense check comes in the form of the observed sky brightness. From my location I can clearly see the Milky way but not to the extent that it 'pops' out from an inky sky background. This aligns with the experience of a Mag 19-20 sky rather than a mag 17 one. Other factors apply I think in the case of the ASTAP measurement and need to be investigated further.
.
.
.