
|
|
|
![]()
Magnetometry using a Digital compass.Why ?Magnetometry reveals the fluctuations in the earth's magnetic field.these fluctuations are caused by the changing compression on a daily basis of the earths magnetic field due to the changing magnetic field from the sun and any charged particle storms such as those that cause aurora. Hence monitoring the local magnetic field components ( preferably all three of them ) gives an idea what's going on at any one time if measured with sufficient sensitivity. Failing to measure all three, the local field strength in the vertical plane should be sufficient. How ? The robotics web sites sell digital compasses such as this one that interface using a serial port or an I2C port.
These compasses comprise sensitive fluxgate magnetometers that, when using a pair of them on board a PCB and mounted at right angles, allow the
Earth's field strength in particular direction to be measured and thus can be used as a digital compass. Given sufficient readings and a bit of statistics the idea was to see whether
I could also use one of these as a real-time aurora-meter on the cheap. Since I was using one of these devices as the dome pointing measurement device - giving pointing readings to half a degree or so, I reckoned sufficient readings
averaged over a few seconds ought to show the diurnal background and any magnetic transients. The test was in the data. Well ?
The data is here, consisting of a set of Excel files with graphs and the original raw text file logs that have been imported into excel.
GraphsTodays data from The university of Lancaster
My data from various dates in Spring 2005. 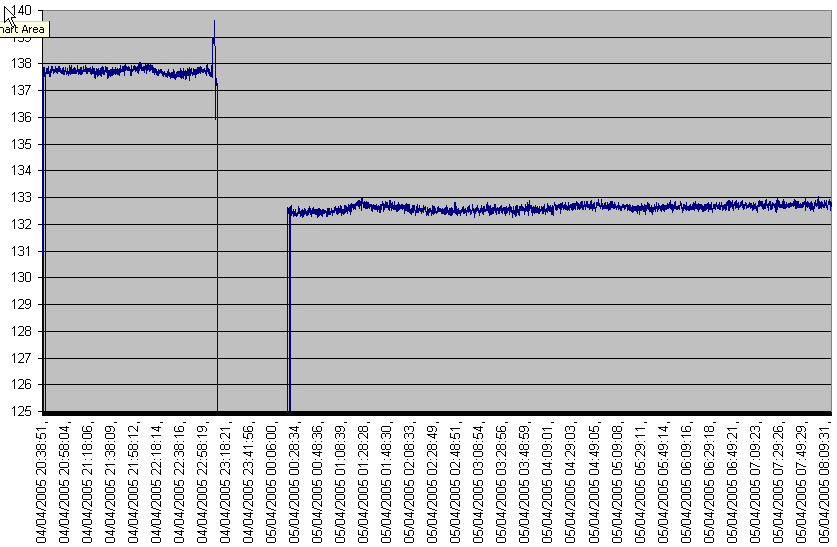 2005 April 4th 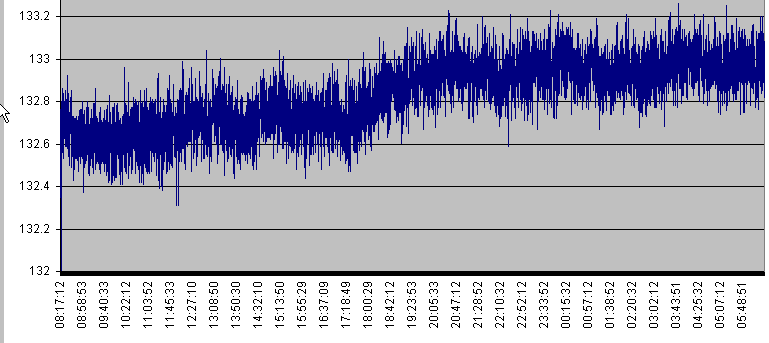 2005 April 5th 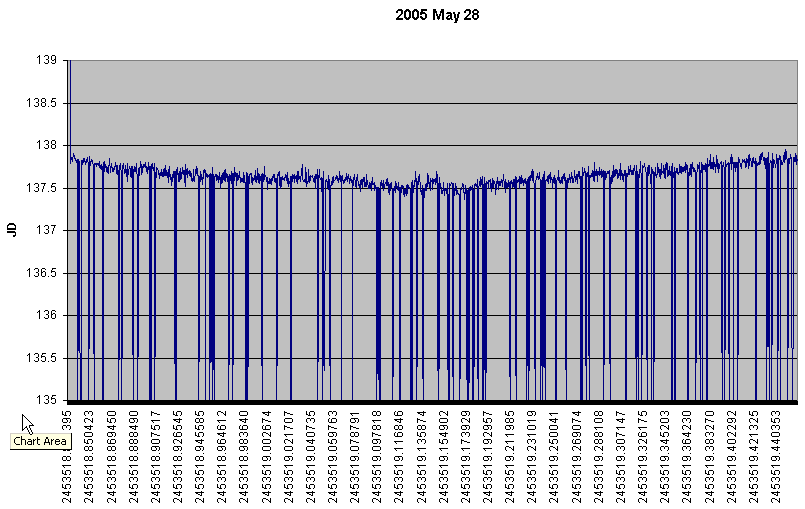 2005 May 28th 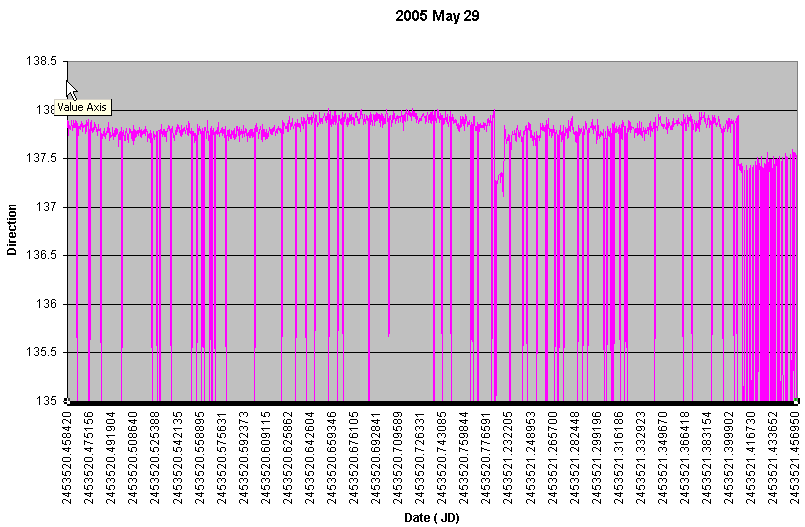 2005 May 29th 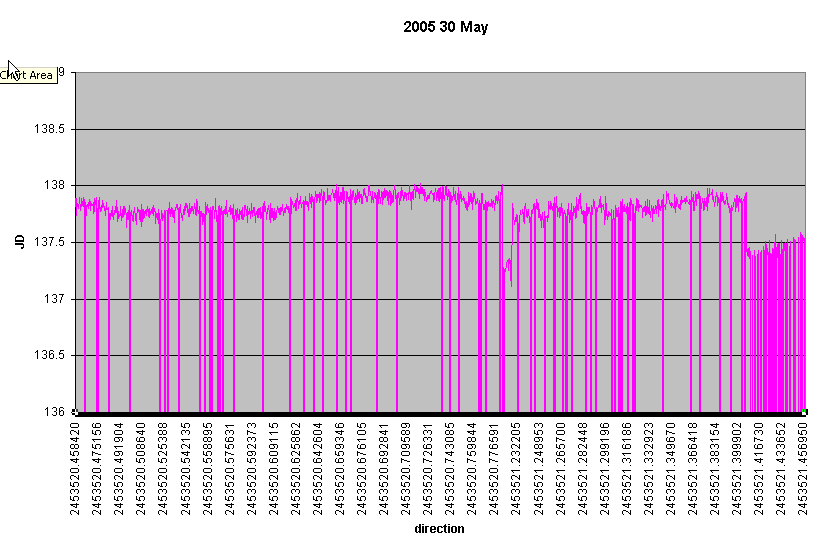 2005 May 30th
The dropouts in my data are due to the occasional missed reading causing average over 60 to be short compared with the more normally correct data.
In summary I claim that you can see the diurnal variation in the data above - i.e. a change of about 0.4 ° corresponds to the diurnal variation
and more than this due to auroral influences will show up clearly. References
|
|
![]()